Methods - Theory
Pre-processing
GC-/Replication timing bias correction
Correction for GC bias
As described in detail by Benjamini and Speed (REF) genomic regions with varying GC content may be sequenced at different depth due to selection bias or sequencing efficiency. Differing raw read counts in these regions even in the absence of copy number alterations can could lead to false positive calls. A GC-bias plot (Figure XY) can be used to visually inspect the bias of a sample. ACEseq first fits a curve to the data using LOWESS (locally weighted scatterplot smoothing, implemented in R) to identify the main copy number state first, which will be used to for a second fit. The second fit to the main copy number state is used for parameter assessment and correction of the data. This two-step fitting is necessary to compensate for large copy number changes that could lead to a misfit. The LOWESS fit as described above interpolates over all 10 kb windows. It thus averages over all different copy number states. If two states have their respective center of mass at different GC content, this first LOWESS fit might be distorted and not well suited for the correction. The full width half maximum (FWHM) of the density over all windows of the main copy number state is estimated for control and tumor. An usual large value here indicates quality issues with the sample.
Correction for replication time
The two bias correction steps described above are done sequentially. A simultaneous 2D LOWESS or LOESS correction would be desirable, but fails due to computational load (the clusters to be fitted have 106 points). Different parameters such as slope and curvature of the both LOWESS correction curves used are extracted. The GC curve parameters is used as quality measures to determine the suitability of the sample for further analysis whereas the replication timing curve parameters is used to infer the proliferation activity of the tumor. We could show a strong correlation between Ki-67 estimates and the slope of the fitted curve (Figure).
Segmentation
Segment reliability
Segment clustering and merging
Allelic adjustment
Calling of Allelic Balance and Imbalance
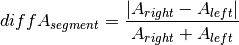
 should be close to zero,
whereas this value should shift more towards one for imbalanced
segments. Thus, a cut-off to differentiate between balanced and
imbalanced segments is needed. In the following we propose a way to
establish a dynamic and sample dependent cut-off. In case a sample has
several segments that correspond to different states, e.g one balanced
and one imbalanced state, these will be represented by different peaks
in the density distribution of . Hence the minima
between the peaks can be used as cut-off. Corresponding to the above
reasoning peaks further left in the distribution are more likely to
represent balanced states. The minimum that differentiates a balanced
from an imbalanced state varies across different samples. Potentially
this depends on the relative contribution of copy number states, tumor
cell content, contamination, subpopulations and sequencing biases.
Empirically the discrimination is optimal for cut-off values in the
range of 0.25 and 0.35. The minimum value of the density function within
this interval is chosen as cut-off. The allelic state is only evaluated
for segments on diplod chromosomes that fullfill certain quality
criteria in order to ensure confident calls. Once
was calculated for a segment and the overall
cut-off determined segments that exceed the cut-off are classified
imbalanced. Segments below the cut-off are classified as balanced.
should be close to zero,
whereas this value should shift more towards one for imbalanced
segments. Thus, a cut-off to differentiate between balanced and
imbalanced segments is needed. In the following we propose a way to
establish a dynamic and sample dependent cut-off. In case a sample has
several segments that correspond to different states, e.g one balanced
and one imbalanced state, these will be represented by different peaks
in the density distribution of . Hence the minima
between the peaks can be used as cut-off. Corresponding to the above
reasoning peaks further left in the distribution are more likely to
represent balanced states. The minimum that differentiates a balanced
from an imbalanced state varies across different samples. Potentially
this depends on the relative contribution of copy number states, tumor
cell content, contamination, subpopulations and sequencing biases.
Empirically the discrimination is optimal for cut-off values in the
range of 0.25 and 0.35. The minimum value of the density function within
this interval is chosen as cut-off. The allelic state is only evaluated
for segments on diplod chromosomes that fullfill certain quality
criteria in order to ensure confident calls. Once
was calculated for a segment and the overall
cut-off determined segments that exceed the cut-off are classified
imbalanced. Segments below the cut-off are classified as balanced.Copy Number Estimation

 is the tumor purity and P is the
tumor ploidy. Using the observed tumor ploidy and the coverage ratio of
a segment (covR:math:_{segment}), the total copy number of a segment
can be estimated as follows:
is the tumor purity and P is the
tumor ploidy. Using the observed tumor ploidy and the coverage ratio of
a segment (covR:math:_{segment}), the total copy number of a segment
can be estimated as follows: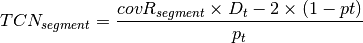
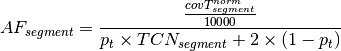
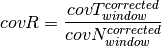
 represents the observed tumor coverage
of a segment. The factor
represents the observed tumor coverage
of a segment. The factor  is introduced to get
from the initial 10 kb window coverage to a per base pair coverage. The
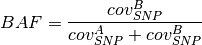
BAF value of a segment can be calculated as follows.
is introduced to get
from the initial 10 kb window coverage to a per base pair coverage. The
BAF value of a segment can be calculated as follows.
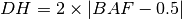
 is the observed tumor coverage of a
segment. The BAF value can now be used to calculate the DH of a segment
according to [eq:DH]. Finally the allele-specific copy numbers are
estimated.
is the observed tumor coverage of a
segment. The BAF value can now be used to calculate the DH of a segment
according to [eq:DH]. Finally the allele-specific copy numbers are
estimated.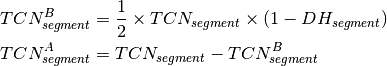
Purity and ploidy estimation


Final output
Once the optimal ploidy and tumor cell content combinations are found the TCN and allele-specific CN will be estimated for all segments in the genome and classified (gain, loss, copy-neutral LOH, loss LOH, gain LOH, sub). If a segments TCN is further than 0.3 away from an integer value it is assumed to originate from subpopulations in the tumor sample that lead to gains or losses in part of the tumor cell population.